Using KPIs in MS Project
Let's assume senior management is asking you to report about project deviations on your schedule. How could we provide this data just having a quick look to MS Project? In this post I'll share with you how to easily identify tasks with Baseline variance by using a KPI.
But first, let's go with some useful explanations:
KPI stands for Key Performance Indicator and is a quantifiable measure of performance over time for a specific objective. KPIs provide targets for teams to shoot for, milestones to measure project progress, and insights that help managers to make better decisions.
On the other side, the project Baseline is the screenshot you take at one point of time. So, once it's stablished, you can use it as a reference to measure and compare your project's progress against (most common baselines are: schedule, cost and scope).
Wouldn't be cool being able to merge these two concepts? Lets see the step by step process to get it done.
Let's go with the step by step
Before going with the process, just share with you that there's a video with my explanations right after these lines.
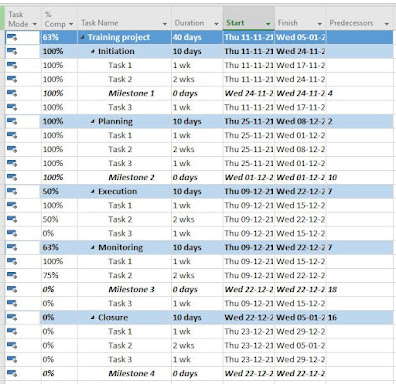
For this exercise we will take as starting point the MS Project file we created during our last MS Project tip post (Timeline view for executive reporting). You can direct download it from here.
Step by step process to set up the Baseline variance KPI
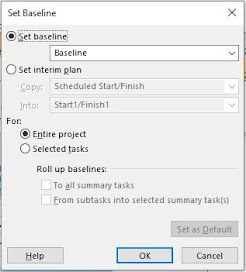
- We need first to create the Baseline. (Project - Set Baseline - Select Baseline number - OK)
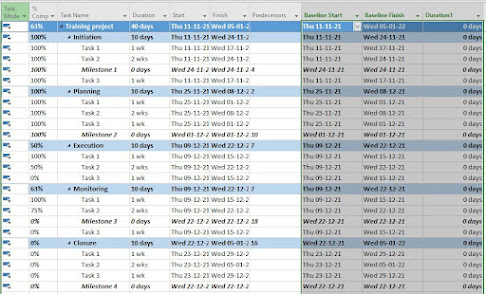
- Once the Baseline is created, we add three additional columns: Baseline Start, Baseline Finish and one more type Duration. We can see there's no variance between Start/Finish dates and the Baseline we created. The Duration column will be used to set up the KPI.
- Right click on Duration1 and Custom Fields.
- We could rename the column with the Rename option. We want to introduce manually the formula, so we select Custom attributes - Formula. The message below will appear and we select OK.
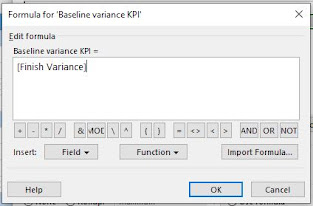
- Once in the Formula box, we introduce the formula below and OK.
- The last step is to change the Values to display option to Graphical indicators and set up the indicators as stated below. We are setting up the KPIs following this criteria:
- Tasks with a delay bigger than 5 days will be flagged with red color.
- Tasks with a delay between 1 and 5 days will be flagged with yellow color.
- Tasks with no delay will be flagged in green color.
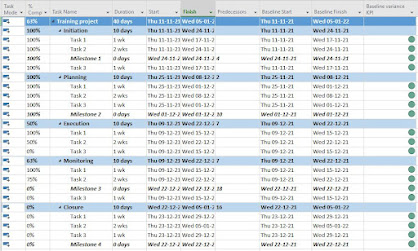
- Once the graphical indicators are configured, we click OK on both boxes and go back to the Gantt view. If we followed the process properly, we should see the KPIs like this.
- Finally, we can do some adjustments (marked in red color) to see how the KPI gets updated fully automatically.
- Delaying one task more than 5 days. We should get red flag.
- Delaying one task 2 days. We should get yellow flag.
- All task with no delay will remain with green flag.
So, what about you? Are you using any KPI on your MS Project? Would you add any additional indicator? Please, feel free to share with me your thoughts about this topic by adding a comment to this post.
The Microsoft Project file I used for this exercise can be downloaded here.






Comments
Post a Comment